
OptiNXT™
OptiNXT™ · AI-Driven Workforce Intelligence & Optimization
Turn Your Workforce From a Cost Structure Into a Competitive Advantag
Most enterprises operate with fragmented HR, Finance, and Operations data, making it difficult to understand where people actually spend their time, whether roles are aligned to value, and whether the workforce is ready for what comes next.
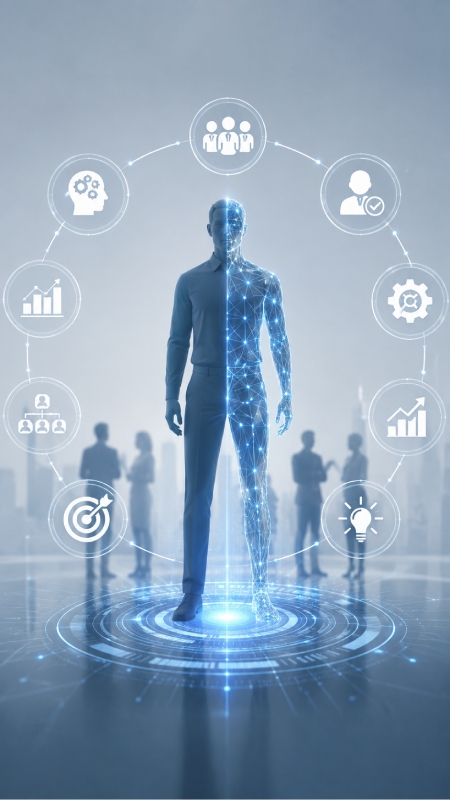
OptiNXT™ closes that gap with a living Workforce Digital Twin: a continuously updating model connecting employee skills, utilization, behaviours, capability scores, process activity, and future role fit. Built on explainable AI with governance, OptiNXT gives HR, Finance, and Compliance leaders the evidence to make defensible decisions about productivity, workforce capacity, automation, role redesign, and future capabilities.

The Workforce Visibility Gap
You Cannot Optimize What You Cannot Quantify
- 75 to 85% of operational effort can concentrate in just 2 to 3 core processes, creating potential points of failure
- 15 to 25% of workforce hours can be lost to redundant, duplicated, low-value work
- High-potential employees can remain trapped in execution roles, contributing to disengagement and attrition
- Organizations lack forward visibility into capability gaps and future workforce requirements
- Hidden capacity remains unidentified because there is no objective basis for workforce optimization or automation decisions
The OptiNXT™ Solution
A Living Digital Twin of Your Workforce
OptiNXT creates a single, continuously updating model of your workforce by connecting:
Skills + Utilization + Behaviours + Processes + Capability + Future Role Fit
It enables leaders to move beyond basic headcount reporting and answer the questions that matter:
Where is capacity being consumed?
Identify workload concentration and utilization imbalances across teams, functions, and locations.
Where is capacity being lost?
What can be automated or redesigned?
Who is ready for what comes next?
What capabilities will we need tomorrow?
What You Get
Four Intelligence Outputs. One Workforce View
Workforce Digital Twin
A unified, real-time model of every employee's skills, utilization, behaviours, capability, and role fit.
Utilization Heatmaps
Visualize workload imbalances and workforce waste by team, function, and location.
FTE Optimization Report
A quantified, defensible business case for automation, process redesign, and capacity release.
Role Matching
Individual readiness scores and learning pathways for future roles, based on data rather than managerial perception.
How It Works
Live in Weeks, Not Quarters.
01
Data Ingestion
2 to 3 Weeks
02
Intelligence Build
2 to 3 Weeks
03
Scenario Modelling
2 to 3 Weeks
04
Go-Live
1 to 2 Weeks
05
Continuous Learning
Ongoing
Why OptiNXT™
Workforce Intelligence Leaders Can Act On.
01
Workforce Digital Twin
The only platform in this proposition designed to create a live, unified model connecting process data, behavioural profiles, capability scores, and future role fit in one continuously updating system.
02
Explainable AI With Governance
Every recommendation carries confidence scores, benchmarks, and rationale, allowing HR, Finance, and Compliance teams to act on and defend decisions without requiring a dedicated data science team.
03
6×6 Capability & Behaviour Model
Soft skills including communication, adaptability, leadership, problem-solving, and decision-making feed directly into role-matching logic alongside technical and process data.
04
Enterprise Integration
OptiNXT connects with the systems organizations already use.
Integration is supported through REST APIs, webhooks, and iPaaS platforms including MuleSoft and Boomi. No on-premise server is required for cloud deployment.
Outcomes That Move the Needle
From Workforce Visibility to Measurable Impact
| DIMENSION | BEFORE OPTINXT™ | AFTER OPTINXT™ |
|---|---|---|
| Productivity | Fragmented, unquantified | +15 to 25% within 12 months |
| FTE Capacity | Never quantified | 30 to 35 FTE freed per 200 employees |
| Process Efficiency | Manual, fragmented | 30 to 40% cycle-time reduction |
| Role-Person Fit | Manager perception | 95%+ data-driven match accuracy |
| Compliance / Audit | Subjective decisions | Explainable AI + full audit trail |
Where OptiNXT™ Creates Value
Six situations where OptiNXT™ makes the difference.
Workforce Optimization
Identify utilization imbalances, workload concentration, and hidden workforce capacity.
Automation Readiness
Identify roles and activities with the strongest potential for automation and quantify the resulting capacity opportunity.
FTE Optimization
Translate workforce data into a defensible business case for capacity release, redesign, and redeployment.
Role & Talent Matching
Identify employees ready for future roles and establish targeted learning pathways to close readiness gaps.
Workforce Planning
Give leadership forward visibility into capability requirements as business models, technologies, and operating environments change.
GCC Optimization
Help Global Capability Centres understand workforce utilization, process concentration, automation readiness, and redeployment opportunities.
Proven Impact
From Data Ingestion to Leadership Recommendation in Six Weeks
82.6% of total FTE capacity was concentrated in just 3 of 12 processes, with a 5.4× utilization variance hidden across the team.
82.6%
FTE Capacity Concentrated in 3 of 12 Processes
5.4×
Utilization Variance Hidden Across the Team
15
Employees at Full Automation Readiness
6-8
FTE Capacity Release Modelled
Result: an objective workforce optimization case delivered in six weeks, from data ingestion to leadership recommendations.
Outcomes That Move the Needle
From Workforce Visibility to Measurable Impact
| TIER | BEST FOR | SCALE |
|---|---|---|
| Starter / Pilot | Fast, scoped proof of concept | Up to 200 employees |
| Professional | Full platform including Scenario Modelling | 200 to 1,000 employees |
| Enterprise / GCC Pack | Multi-entity deployment & custom integrations | 1,000+ employees |
| BPaaS / Managed | Fully managed workforce intelligence | Any scale |
The Bottom Line
Know Where Your Workforce Creates Value.
- See where capacity is being consumed.
- Quantify where value is being lost.
- Identify what can be automated or redesigned.
- Match people to the roles of tomorrow.
- Build a workforce that is measurably more productive and future-ready.